Higher Ed
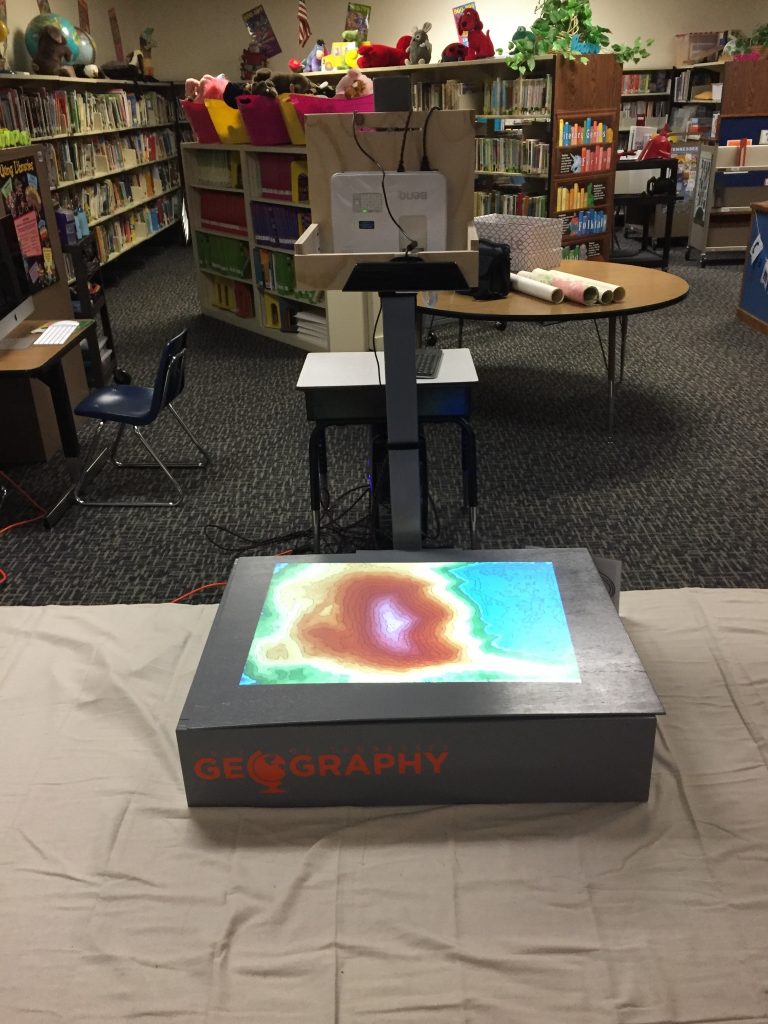
The sandbox was originally built to be used by our geography students here at UTK, specifically for remote sensing classes and for terrain analysis. We have gone on to use the sandbox for other classes like physical geography. Unfortunately I don’t teach any of those classes so I’ll have to ask those professors and graduate students to provide me with the specifics for their classroom.
K-12
We have to start by thanking the members of an AR Sandbox Google Group who have shared their experiences and ideas with us. Learn more about the Google Group here.
So far, we have been using the AR Sandbox to teach students about physical geography, map reading, and watersheds. Here are a few ideas we’ve had as well as specific strategies we use.
Conceptualizing a flat map into 3 dimensions
One skill that many people have a hard time with is conceptualizing a three dimensional surface from a flat topographic map. A great way to start that discussion is to use the “Pause Topography” function to build terrain in your sandbox, pause the sensor, and then place the cover back on the sandbox. I know this seems counter intuitive since the entire point is to play with the sand, but hear me out.
When kids see the sandbox they lose their minds. I’ve found it easier to gather everyone around the sandbox, explain our two rules (everyone will get a turn so don’t crawl over your classmates; we don’t throw sand because we don’t want to get sand in people’s faces), and start asking them questions about maps relevant to their age and experiences. For instance:
- Have you ever seen a map before? Tell me about that.
- Have you ever used a map before? Tell me about that.
- What types of maps are there?
- What do you see on the maps?
- Then ask the students if what they see on the cover looks like a map.
- Ask the students what they think the map is showing. I have a lot of students tell me it looks like a weather map and I have to agree with them. The contour lines look just like pressure isolines and the colors could easily represent temperature.
- I ask a lot of questions to get them to start thinking about topography specifically. For instance, what does the blue represent? They always guess water. And from there I can start to ask questions related to the direction water flows, where you find water (tops of mountains or bottoms of valleys). And from here we start to figure out that the blue on the map represents low points.
- Once we know that blue is low, we can start asking what that means about the height of everything around the blue (must be higher). I always try and build a mountain in the sandbox that turns white at the top so that I can ask them about what they know about mountain tops in winter.
- And then from here it’s a series of leading questions about contour lines.
- To summarize we make some hypotheses about where the high points on the map are, where the low points are, where the map will be steep, and where the map will be flat. Then we take the lid off for the big reveal.
Once the lid is off the kids will inevitably ooh and ahh and then immediately ask if they can touch it. I make them verify their hypotheses first and then we start moving sand. This is a good time to remind the students of our two rules so that the kids in the back row don’t get too antsy.
For several minutes I just let the kids build what they want so they start to make connections between the colors, lines, and height of the sand. At some point a student will accidentally make rain in the sandbox and that’s always a good time to teach them how. After that I usually ask the front row of students to work together to build a large landform like a tall mountain. Then we can review what we’ve learned about colors, contour lines, and elevations. Plus we can add rain to different sides of the mountain and talk about watersheds.
Then it’s time to switch the students out and I repeat the process from above. We try and build a different landform, like a giant lake or make a big valley so they see some different landforms.
If the kids have learned about landforms in class, then I ask them to make different ones for me like plateaus, valleys, islands, peninsulas, etc. If we make a big lake (or ocean depending on scale) then I like to talk to them about how the Hawaiian islands formed. I’ll ask one student to get a handful of sand and drop it in the middle of the lake and the students will start to see the contour lines on the lake bottom change. It usually takes several handfuls of sand before the height is enough to switch from blue to green, but the kids really love this too.
If you have less than 45 minutes with a group of students, and the group of students is between 20-30, the above usually takes the entire time. If you have a smaller group of students or you have between 40-60 minutes per group, then you can use the mini sandboxes.
Mini sandboxes
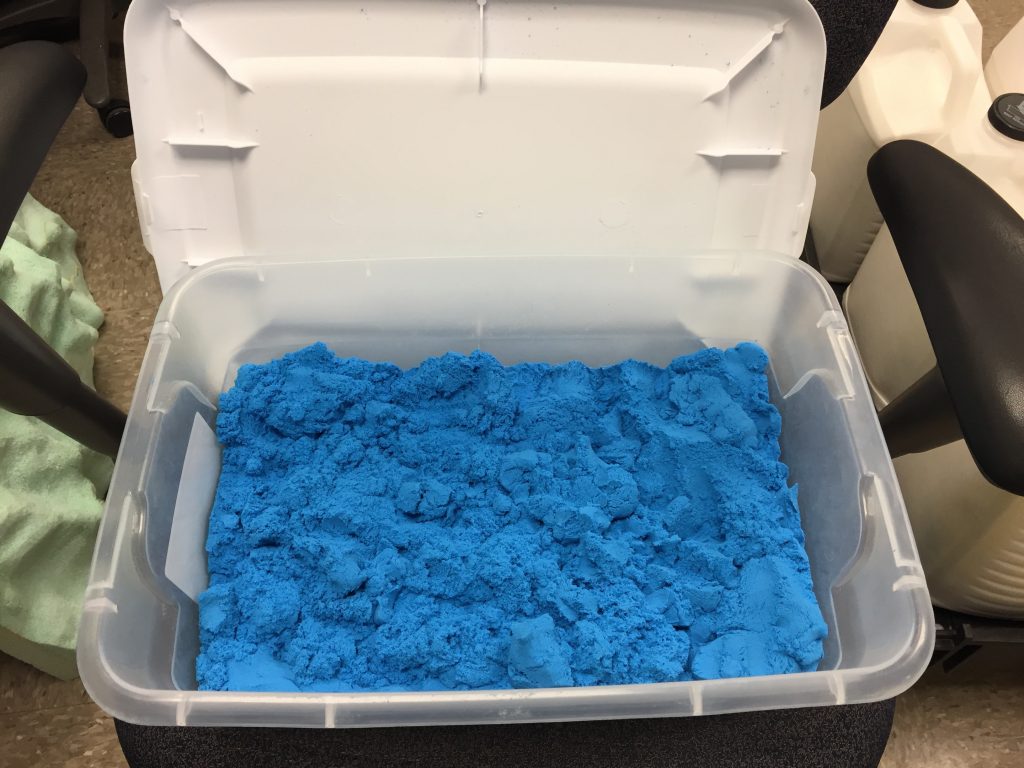
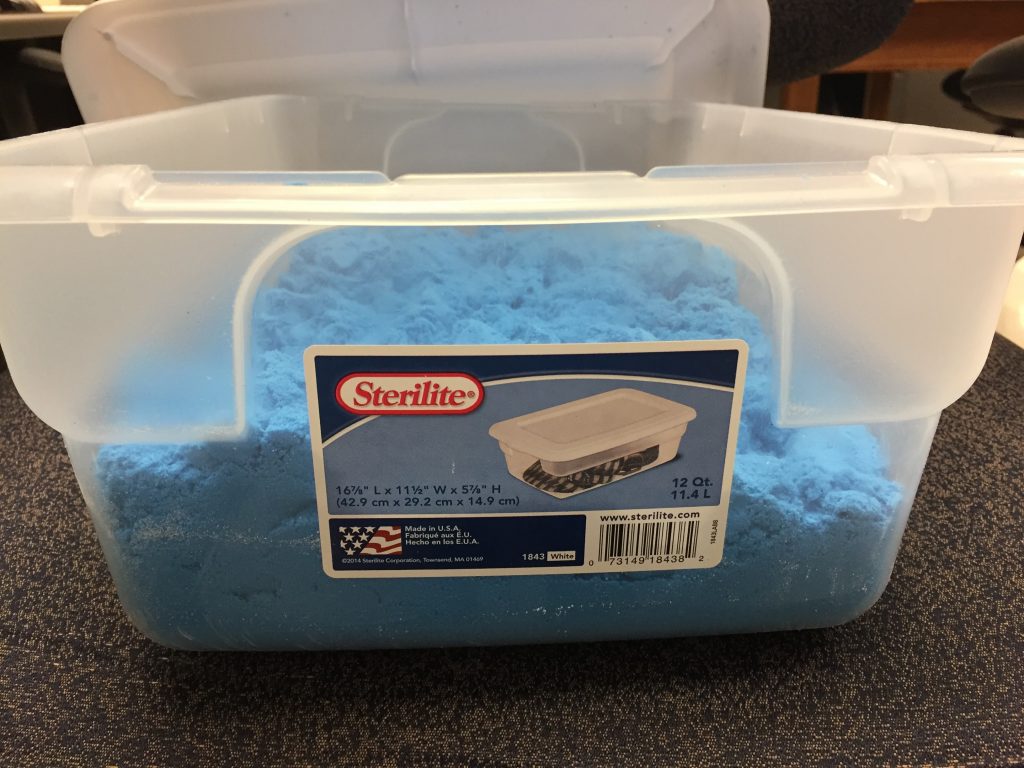
If you really want to see if the students have understood the concept of contour lines and how they relate to topography, you can use a set of mini sandboxes and fake contour maps. After we’ve spent time in the large sandbox, I’ll ask the teachers to break the students into small groups and assign each team to a different color of sand.
Each team is given a set of four fake contour maps (copied front and back, laminated to make them last longer) that have the same aspect ratio as the mini sandboxes.
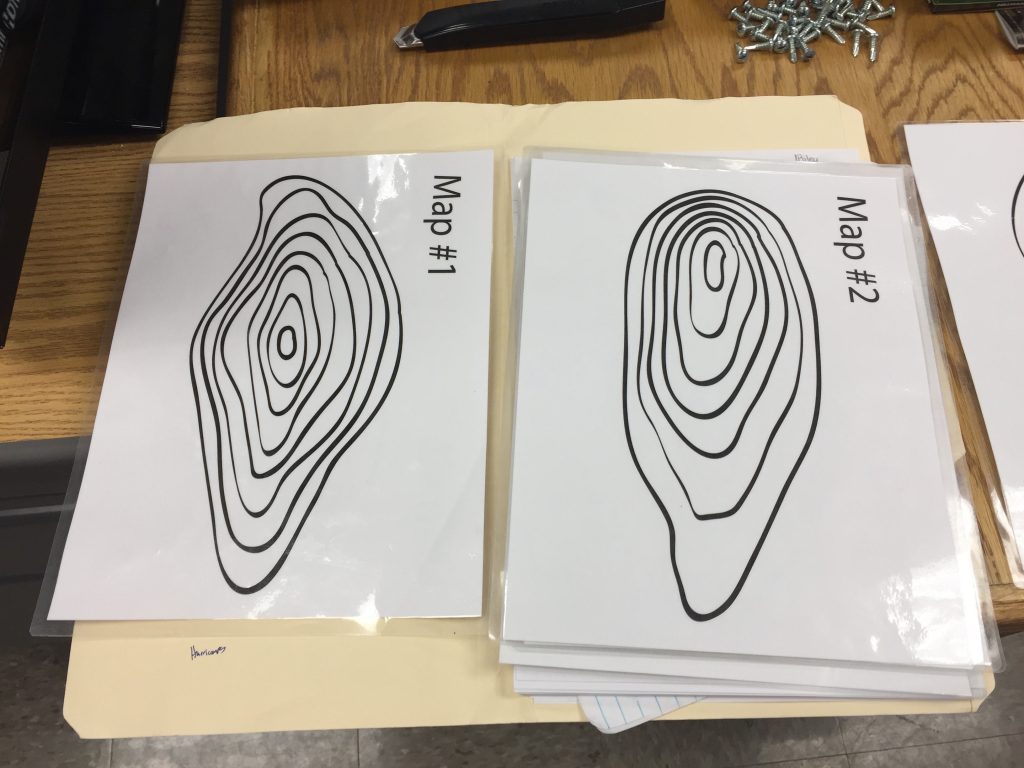
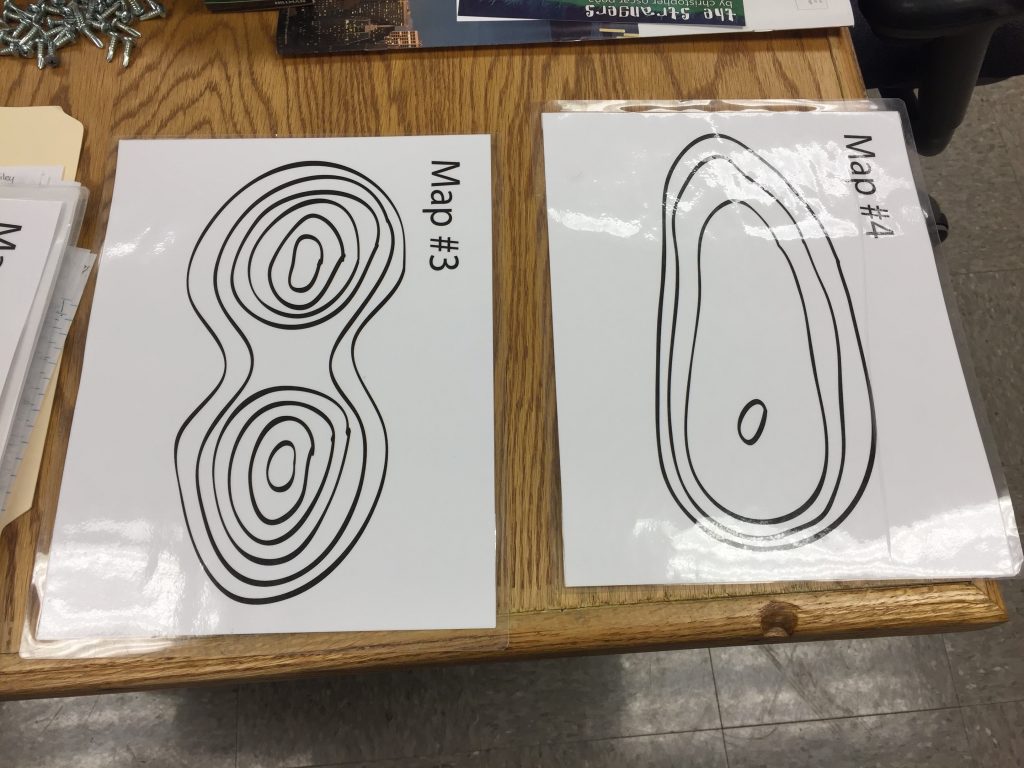
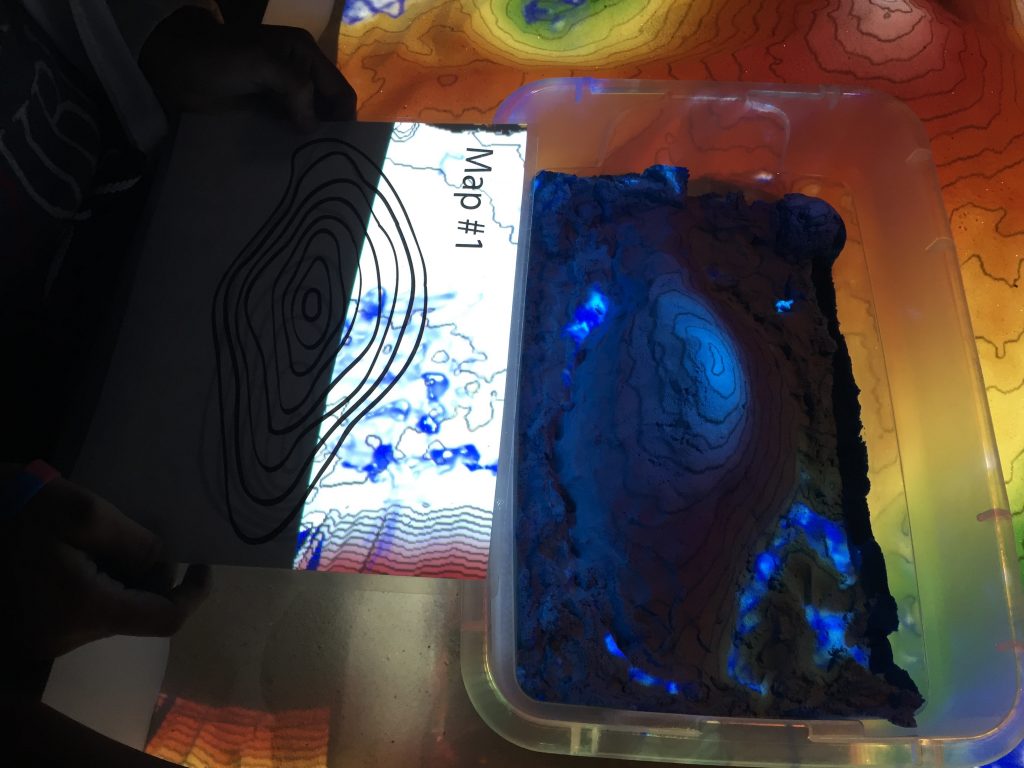
I ask the teams to create the landform they see on the map in their own mini sandbox. Once they think they have it figured out, I ask each team to bring their mini sandbox to the large sandbox. We place the mini sandbox in the large sandbox and let it draw the contour lines. Then we compare the map to the contour lines and talk about what parts of the sandbox are a good match and which parts need a little more work. I only have three mini sandboxes currently and need about 3 or 4 more.
While the colored sand makes it easy to assign students to a particular group (blue team, green team, etc), the color will rub off on students’ hands and clothes and some will inevitably get dropped on carpet.
Pre-Built Lesson Plans
- USGS AR Sandbox Lesson Plan (pdf)
- AR-sandbox.eu (website)
- River Wey Trust (website)
- Stueben County Soil and Water Conservation District (website)
Hygiene
Always remind students, teachers, parents and anyone else who has touched the sand to wash their hands really well when they are done. There have been trillions of hands in the sand.
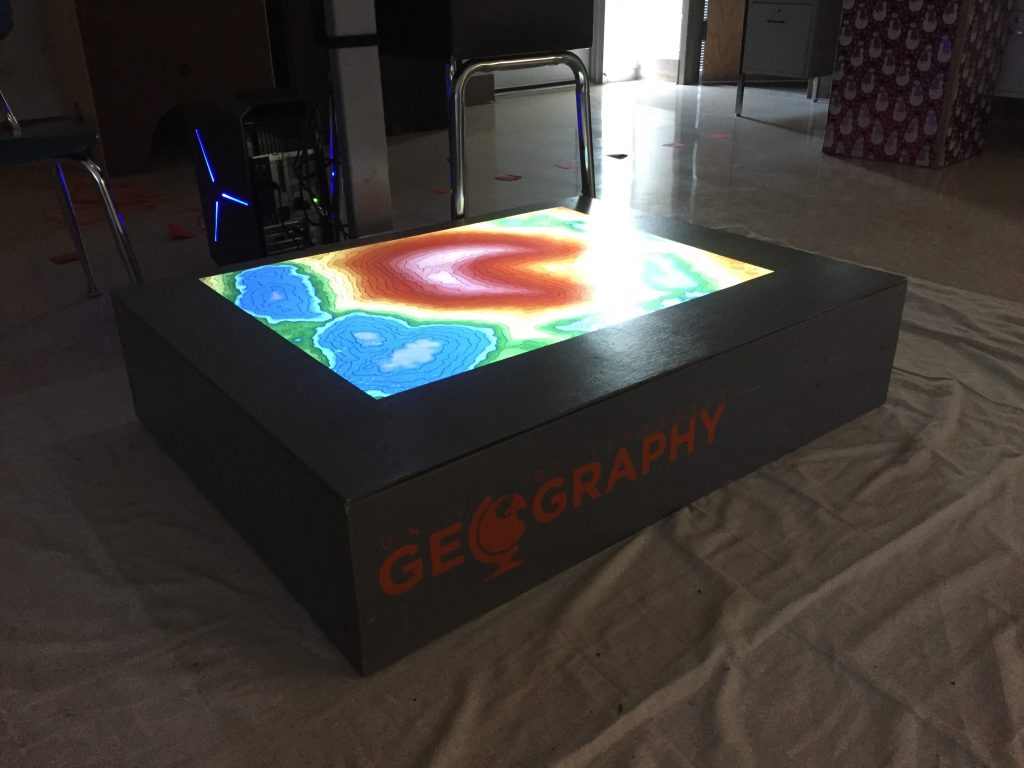
How does it work?
Students, parents, and administrators always want to know how the system works. I’m not an expert so I explain everything how I understand it. I start by explaining the hardware (sensor, computer, projector) and what the sensor measures (distance between sensor and sand), and how the software and computer work together to determine where to draw the contours and what color to display on the sand.
This is also a good opportunity to explain, at a high level, how augmented reality works. A lot of students, especially middle school and older, already know about and have played Pokemon Go, so I try and relate the two. For instance, I ask them “where do you go to find a Pokemon that lives in water, in Pokemon Go”? I always have to ask them what this type of Pokemon is called because I never remember. They always know that you actually have to go to a real lake, pond, river, etc. So this is the key of tying the virtual world on their phone to the real world. Same with the sandbox, virtual world of the projector on top of the real world of the sand. Also, students (and a few parents) will ask where we get the colored sand. This is a good opportunity to shade the lens on the projector and show everyone that the sand is white.
Making the case for science research
Whenever I meet parents, teachers, and administrators they always have specific questions about how the system works, how much it costs, and when can I bring it to their school. I almost always take this opportunity to let these adults know that this project is possible because of an NSF grant so they see how their tax dollars can be used to help their children and students. And we always thank Oliver Kreylos and his team at UC Davis for making the software free and open source.
3D Printer Files
Many schools now have their own 3D printers. Using readily available 3D printer files enables the creation of physical objects you can use in the sandbox to demonstrate specific concepts.
- For example, use dams to create reservoirs and buildings to represent homes. Remove the dam and watch how the flood waters wash over the buildings downstream.
- Adjust the sea level in the AR sandbox configuration file to focus on bathymetry and fill your sandbox with sea creatures, submarines, and ships.
- Adjust the sea level in the AR sandbox configuration file to use just shades of tans, oranges, and reds and model the surface of mars using rovers
All links below go directly to Thingiverse. Please note we have not tested any of these files and they are listed as examples.
- Industrial Buildings
- Farms
- Buildings
- Houses
- Apartments
- Dams
- Bridges
- Mars/Space Exploration
- Submarine